Indication and
Limitations of Use:
Parsabiv® (etelcalcetide) is indicated for the treatment of secondary hyperparathyroidism (HPT) in adult
patients with chronic kidney disease (CKD) on hemodialysis. Read More

Indication and
Limitations of Use:

Parsabiv® (etelcalcetide) is indicated for the treatment of secondary hyperparathyroidism (HPT) in adult
patients with chronic kidney disease (CKD) on hemodialysis.

Parsabiv® has not been studied in adult patients with parathyroid carcinoma, primary
hyperparathyroidism, or with CKD who are not on hemodialysis and is not recommended for use in these
populations. Read Less

  • Placebo-Controlled Studies

  • Real-World Evidence

  • Head-to-Head Study

Parsabiv®
(etelcalcetide) safety and efficacy were evaluated
in 2 placebo-controlled studies1,3-7

Study Design

Randomization: Parsabiv® (n = 509) and Placebo (n = 514), plus vit. D and/or P binders, if prescribed

*Stratified by region, mean screening PTH, and recent oral cincacalcet use.

  • Two phase 3, 26-week, multicenter, randomized, double-blind, placebo-controlled clinical studies comparing Parsabiv® (etelcalcetide) with placebo in patients with CKD on hemodialysis with iPTH > 400 pg/mL and corrected calcium ≥ 8.3 mg/dL; N = 1023
  • Parsabiv® or placebo administered TIW into the venous line of the dialysis circuit at the end of hemodialysis during rinse back or intravenously after rinse back
  • Patients in both treatment arms could be treated with vitamin D sterols and/or phosphate binders, if prescribed
  • Mean baseline iPTH in the Parsabiv® group and placebo group were 847 pg/mL and 836 pg/mL, respectively
  • During the EAP, the average weekly dose of active vitamin D (IV paricalcitol equivalent) was 16.7 µg in the Parsabiv® group and
     14.5 µg in the placebo group
  • The average dose of Parsabiv® at the time of the EAP (defined as weeks 20 through 27, inclusive) was 7.2 mg TIW
Titration
  • The starting dose of Parsabiv® was 5 mg TIW at the end of hemodialysis
  • The dose was titrated at weeks 5, 9, 13, and 17 to achieve predialysis serum iPTH ≤ 300 pg/mL. The dose could be increased in 
    2.5 mg or 5 mg increments based on predialysis iPTH and cCa concentrations
  • The minimum dose was 2.5 mg and the maximum dose was 15 mg
  • Parsabiv® was withheld if any of the following were observed: iPTH < 100 pg/mL (two consecutive measurements), corrected
    calcium < 7.5 mg/dL, symptomatic hypocalcemia, other ongoing adverse events
  • Investigators were blinded to central laboratory serum PTH values, and routine local PTH monitoring during the study was suspended

78% of patients who received Parsabiv®
achieved > 30% reduction in mean PTH8

Percentage of patients achieving > 30% reduction in mean iPTH from baseline

Graph showing 78% of patients on Parsabiv® plus vitamin D and/or phosphate binders* had > 30% iPTH reductions

One-third of patients given Parsabiv® had a reduction in PTH
by week 4*—and by week 8 that number nearly doubled9

Post-hoc analysis: Time to first occurrence* of  > 30% reduction
in iPTH from combined placebo-controlled studies

Graph showing 34% of patients given Parsabiv® achieved first occurrence of > 30% reduction in PTH by week 4, 65% by week 8

Parsabiv® + vitamin D and/or phosphate binders; n = 509

Placebo + vitamin D and/or phosphate binders; n = 514

Analysis is exploratory and has not been adjusted for multiple comparisons. No conclusions of statistical or clinical significance
can be drawn.

Rolling averages of 3 iPTH values (from previous, current, and next visit) were used.

  • The starting dose of Parsabiv® (etelcalcetide) was 5 mg TIW at the end of hemodialysis
  • The dose was titrated at weeks 5, 9, 13, and 17 to achieve predialysis serum iPTH ≤ 300 pg/mL. The dose could be increased in
    2.5 mg or 5 mg increments based on predialysis iPTH and cCa concentrations

Parsabiv® provided significant reductions across 3 key
sHPT lab values vs placebo8,10,*

Mean iPTH, phosphate, and corrected calcium over time

Scroll over to view full chart

Graph depicting reductions in cCa provided by Parsabiv® through 78 weeks

Parsabiv® + vitamin D and/or phosphate binders§

Placebo + vitamin D and/or phosphate binders§

Switched from placebo in parent studies to Parsabiv® + vitamin D and/or phosphate binders§

Mean % (absolute) change from baseline

Graphic showing absolute (mean %) change from baseline for cCa Graphic showing absolute (mean %) change from baseline for cCa

The majority of patients
given Parsabiv® achieved the KDIGO®
goal range* for PTH12,13

Subgroup analysis: Patients achieving iPTH < 600 pg/mL during EAP by screening iPTH3,12

Graph showing the % of patients who achieved KDIGO® goal range for PTH when Parsabiv® was initiated at different baselines

Parsabiv® + vitamin D and/or phosphate binders

Placebo + vitamin D and/or phosphate binders

Overall, 76.5% of Parsabiv® patients (n = 497) achieved PTH < 600 pg/mL during the combined phase 3 trials.12

Secondary endpoint: In phase 3 trials, 53.4% of Parsabiv® patients achieved iPTH ≤ 300 pg/mL vs 5.8% of placebo patients
during the EAP (P < 0.001).8

Analysis is exploratory and has not been adjusted for multiple comparisons. No conclusions of statistical or clinical significance can be drawn.

Dr. Batarsé: Parsabiv® in the Treatment of sHPT

Watch nephrologist Dr. Batarsé talk about the role of Parsabiv® in the treatment of sHPT

What is Real-World Evidence and why does it matter?

REAL LAB VALUES
from
REAL NEPHROLOGISTS

REAL RESULTS
from
REAL PATIENTS

LIFE IS NOT A
CONTROLLED
STUDY

Real-World Evidence collection criteria2

Retrospective analysis of patients collected from large and medium dialysis organizations,
which traditionally have more protocol restrictions

Selection criteria graphic

ALADIN* data reports include lab values for 1983 adult patients new to Parsabiv® (etelcalcetide) between February 2018 through June 2020

Inclusion and Exclusion information table graphic Inclusion and Exclusion information table graphic
Parsabiv® (etelcalcetide) 5 mg dosage graphic

Parsabiv® dosing was consistent with prescribing information

  • First Parsabiv® prescription required 5 mg TIW dosing
  • Baseline cCa ≥ 8.3 mg/dL for all patients

Real-World Evidence:
64% of patients prescribed Parsabiv®
achieved a > 30% reduction PTH by week 242

Percentage of patients achieving > 30% reduction in mean iPTH from index date

Real-World Evidence chart showing that 64% of patients who received Parsabiv® achieved > 30% reduction in mean PTH

Data are derived from real-world sources and not from a controlled clinical study. Analysis is exploratory and has not been
adjusted for multiple comparisons. No conclusion of statistical or clinical significance can be drawn.

Real-World Evidence:
By week 4, 37% of patients given Parsabiv®
achieved a > 30% reduction* in PTH2

Real-World Evidence showing 37% of patients given Parsabiv® achieved first occurrence of > 30% reduction in PTH by week 4

Real-World Evidence:
Parsabiv® achieved reductions in all 3 sHPT labs2

Real-World Evidence depicting an increase in PTH, P, and cCa prior to initiating Parsabiv and then showing reductions through 24 weeks; Real-World Evidence showing absolute (mean %) change from baseline for iPTH (-35%), P (-5%), and cCa (-6%)

Real-World Evidence:
Patients given Parsabiv® achieved PTH < 600 pg/mL at
week 24 when initiated at baseline PTH ≤ 1000 pg/mL2

Real-World Evidence of patients who achieved PTH < 600 pg/mL at week 24 when initiated at baseline PTH ≤ 1000 pg/mL

Data are derived from real-world sources and not from a controlled clinical study. Analysis is exploratory and has not been
adjusted for multiple comparisons. No conclusion of statistical or clinical significance can be drawn.

Real-World Evidence:
The majority of patients given Parsabiv® achieved the
KDIGO® goal range* for PTH2,4,6

% of patients who achieved iPTH < 600 pg/mL by week 242,6

Real-World Evidence showing the majority of patients given Parsabiv® at a PTH ≤ 1000 achieved the KDIGO® goal range

Values represent percent of patients achieving the iPTH goal of < 600 pg/mL within 24 weeks. Overall, 77% of patients
(n = 1535) achieved PTH < 600 pg/mL. 43% of patients (n= 859) achieved PTH ≤ 300 pg/mL.6

Data are derived from real-world sources and not from a controlled clinical study. Analysis is exploratory and has not been
adjusted for multiple comparisons. No conclusion of statistical or clinical significance can be drawn.

Real-World Evidence:
3 key lab levels and average Parsabiv® dose1,2,7,8

Graph showing comparison between the PTH, P, and cCa reductions and average Parsabiv® dose in Real-World Evidence and Clinical Trial Data

Parsabiv® in Practice

Nephrology professionals discuss the ins and outs of using Parsabiv® in the clinic

Parsabiv® (etelcalcetide) was evaluated in a head-to-head study vs
Sensipar® (oral cinacalcet) tablets4,5

Study Design

Randomization: Parsabiv® (n = 340) and Sensipar® (n = 343), plus vitamin D and/or phosphate
  • A phase 3, 26-week, randomized, active-controlled, double-blind, double-dummy study comparing Parsabiv® with Sensipar® in
    patients with CKD on hemodialysis with iPTH > 500 pg/mL and corrected calcium ≥ 8.3 mg/dL; N = 683
  • Parsabiv® IV TIW + daily oral placebo vs daily oral Sensipar® + placebo IV TIW for 26 weeks
  • Mean baseline iPTH in the Parsabiv® group and Sensipar® group were 1092 pg/mL and 1139 pg/mL, respectively
  • The average weekly dose of investigational product during the EAP (defined as weeks 20 through 27, inclusive) was 21 mg for
    Parsabiv® and 405 mg for Sensipar®
  • Adherence to investigational product through 26-week study period was:

    97% for Parsabiv®

    94% for Sensipar®

Titration4
  • Parsabiv® (etelcalcetide) dose uptitrated from 5 mg in 2.5 mg or 5 mg increments, up to a maximum dose of 15 mg, at weeks 5, 9, 13,
    and 17 to target predialysis 100 ≤ iPTH ≤ 300 pg/mL while maintaining cCa ≥ 8.3 mg/dL
  • Sensipar® dose uptitrated from 30 mg daily in 30 mg increments, up to a maximum dose of 180 mg daily, at weeks 5, 9, 13, and 17 to
    target predialysis 100 ≤ iPTH ≤ 300 pg/mL while maintaining cCa ≥ 8.3 mg/dL
  • Parsabiv® was withheld if any of the following were observed: iPTH < 100 pg/mL (two consecutive measurements), corrected calcium
    < 7.5 mg/dL, symptomatic hypocalcemia, other drug-related adverse events
  • Investigators were blinded to central laboratory serum iPTH values, and routine local iPTH monitoring during the study was suspended
Important Study Information
  • At trial end, average Parsabiv® doses were higher than Sensipar® doses (relative to each product’s respective maximally recommended dose) and a greater proportion of Parsabiv®-treated subjects achieved a maximally recommended dose
  • The Parsabiv® arm had1:

    A higher relative starting dose

    Higher relative dose increments per dose escalation steps

    Fewer dose steps needed to reach the maximally recommended dose

  • No differences in tolerability were identified to explain the lack of dose adjustment in the Sensipar® arm

Parsabiv® and Sensipar® patients who
achieved a > 30% reduction from baseline in mean PTH4,5

Percentage of patients achieving > 30% reduction in mean iPTH from baseline

Chart depicting that 78% of patients given Parsabiv® achieved a 77.9% reduction in mean PTH

Given the single, limited-duration (26-week) study design and important study information, these data should not be
interpreted as providing evidence of superiority of Parsabiv® to Sensipar®. The potential impact of the difference between
treatment groups on clinical outcomes has not been studied, and the clinical meaningfulness of such a difference is unknown.

Evaluating additional endpoints in the head-to-head study

Because the primary endpoint was met, the statistical analysis plan called for the sequential testing of the key secondary endpoints,
including mean number of days of vomiting or nausea per week in the first 8 weeks.

  • No statistically significant difference between the two groups was observed for the secondary endpoint evaluating the mean number of days of vomiting or nausea per week in the first 8 weeks
  • Therefore, other secondary and exploratory endpoints were subsequently evaluated, but were not formally tested for statistical significance. These endpoints included:

    Percent change from baseline in mean cCa during the EAP

    Percent change from baseline in mean phosphate during the EAP

    Percent change from baseline in iPTH during the EAP

In the head-to-head study, patients given Parsabiv®
achieved reductions in all 3 key sHPT labs5

Mean iPTH, phosphate, and corrected calcium over time

Graphic depicting absolute reductions in iPTH for patients given Parsabiv®

Parsabiv® + vitamin D and/or phosphate binders*

Sensipar® (cinacalcet) + vitamin D and/or phosphate binders*

Mean % (absolute) change from baseline

Graphic showing absolute (mean %) change from baseline for iPTH, P, and cCa

Analysis is exploratory and has not been adjusted for multiple comparisons. No conclusions of statistical or clinical significance
can be drawn.

Setting clinical expectations for sHPT patients prescribed Parsabiv®

Clinical Reference Guide

Important clinical data to share with your colleagues

Dosing-and-Admin

Administration, Storage, & Handling

Important tips and details on working with Parsabiv®

Peer-advocate-02

Resources

Tools and educational materials for the care team

Important Safety Information for Parsabiv®

Contraindication: Parsabiv® (etelcalcetide) is contraindicated in patients with known hypersensitivity to
etelcalcetide or any of its excipients. Hypersensitivity reactions, including face edema and anaphylactic reaction,
have occurred.

Hypocalcemia: Parsabiv® lowers serum calcium and can lead to hypocalcemia, sometimes severe. Significant
lowering of serum calcium can cause QT interval prolongation and ventricular arrhythmia. Patients with
conditions that predispose to QT interval prolongation and ventricular arrhythmia may be at increased risk for
QT interval prolongation and ventricular arrhythmias if they develop hypocalcemia due to Parsabiv®. Closely
monitor corrected serum calcium and QT interval in patients at risk on Parsabiv®.

Significant reductions in corrected serum calcium may lower the threshold for seizures. Patients with a history of
seizure disorder may be at increased risk for seizures if they develop hypocalcemia due to Parsabiv®. Monitor
corrected serum calcium in patients with seizure disorders on Parsabiv®.

Concurrent administration of Parsabiv® with another oral calcimimetic could result in severe, life-threatening
hypocalcemia. Patients switching from cinacalcet to Parsabiv® should discontinue cinacalcet for at least 7 days
prior to initiating Parsabiv®. Closely monitor corrected serum calcium in patients receiving Parsabiv® and
concomitant therapies known to lower serum calcium.

Measure corrected serum calcium prior to initiation of Parsabiv®. Do not initiate in patients if the corrected serum
calcium is less than the lower limit of normal. Monitor corrected serum calcium within 1 week after initiation or
dose adjustment and every 4 weeks during treatment with Parsabiv®. Measure PTH 4 weeks after initiation or
dose adjustment of Parsabiv®. Once the maintenance dose has been established, measure PTH per clinical
practice.

Worsening Heart Failure: In Parsabiv® clinical studies, cases of hypotension, congestive heart failure, and
decreased myocardial performance have been reported. Closely monitor patients treated with Parsabiv® for
worsening signs and symptoms of heart failure.

Upper Gastrointestinal Bleeding: In clinical studies, 2 patients treated with Parsabiv® in 1253 patient years of
exposure had upper gastrointestinal (GI) bleeding at the time of death. The exact cause of GI bleeding in these
patients is unknown and there were too few cases to determine whether these cases were related to Parsabiv®.

Patients with risk factors for upper GI bleeding, such as known gastritis, esophagitis, ulcers or severe vomiting,
may be at increased risk for GI bleeding with Parsabiv®. Monitor patients for worsening of common Parsabiv® GI
adverse reactions and for signs and symptoms of GI bleeding and ulcerations during Parsabiv® therapy.

Adynamic Bone: Adynamic bone may develop if PTH levels are chronically suppressed.

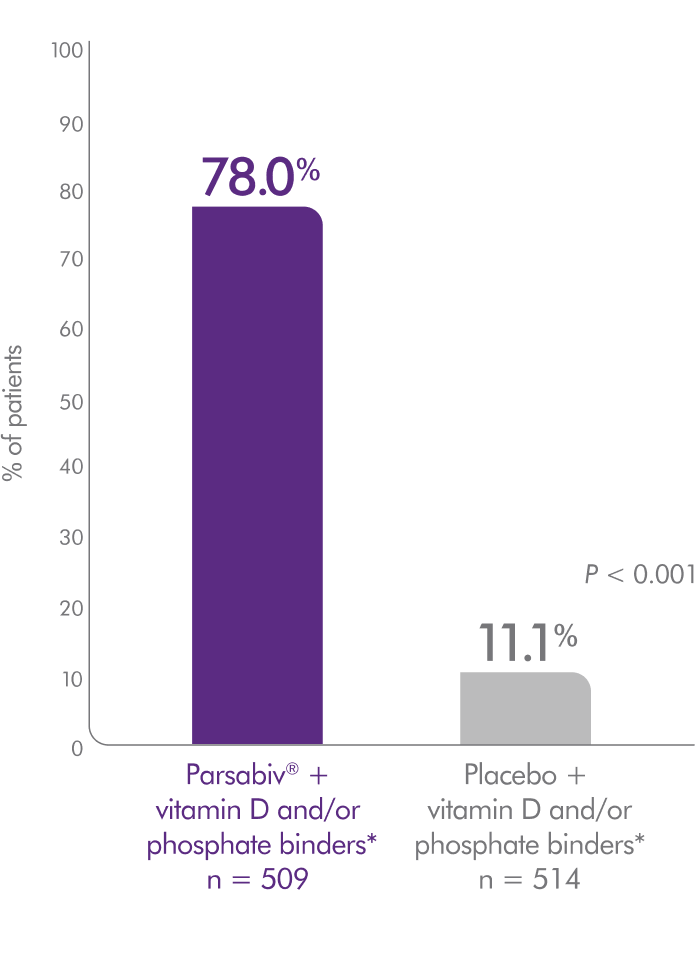
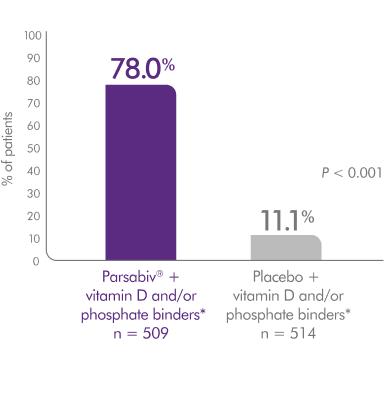
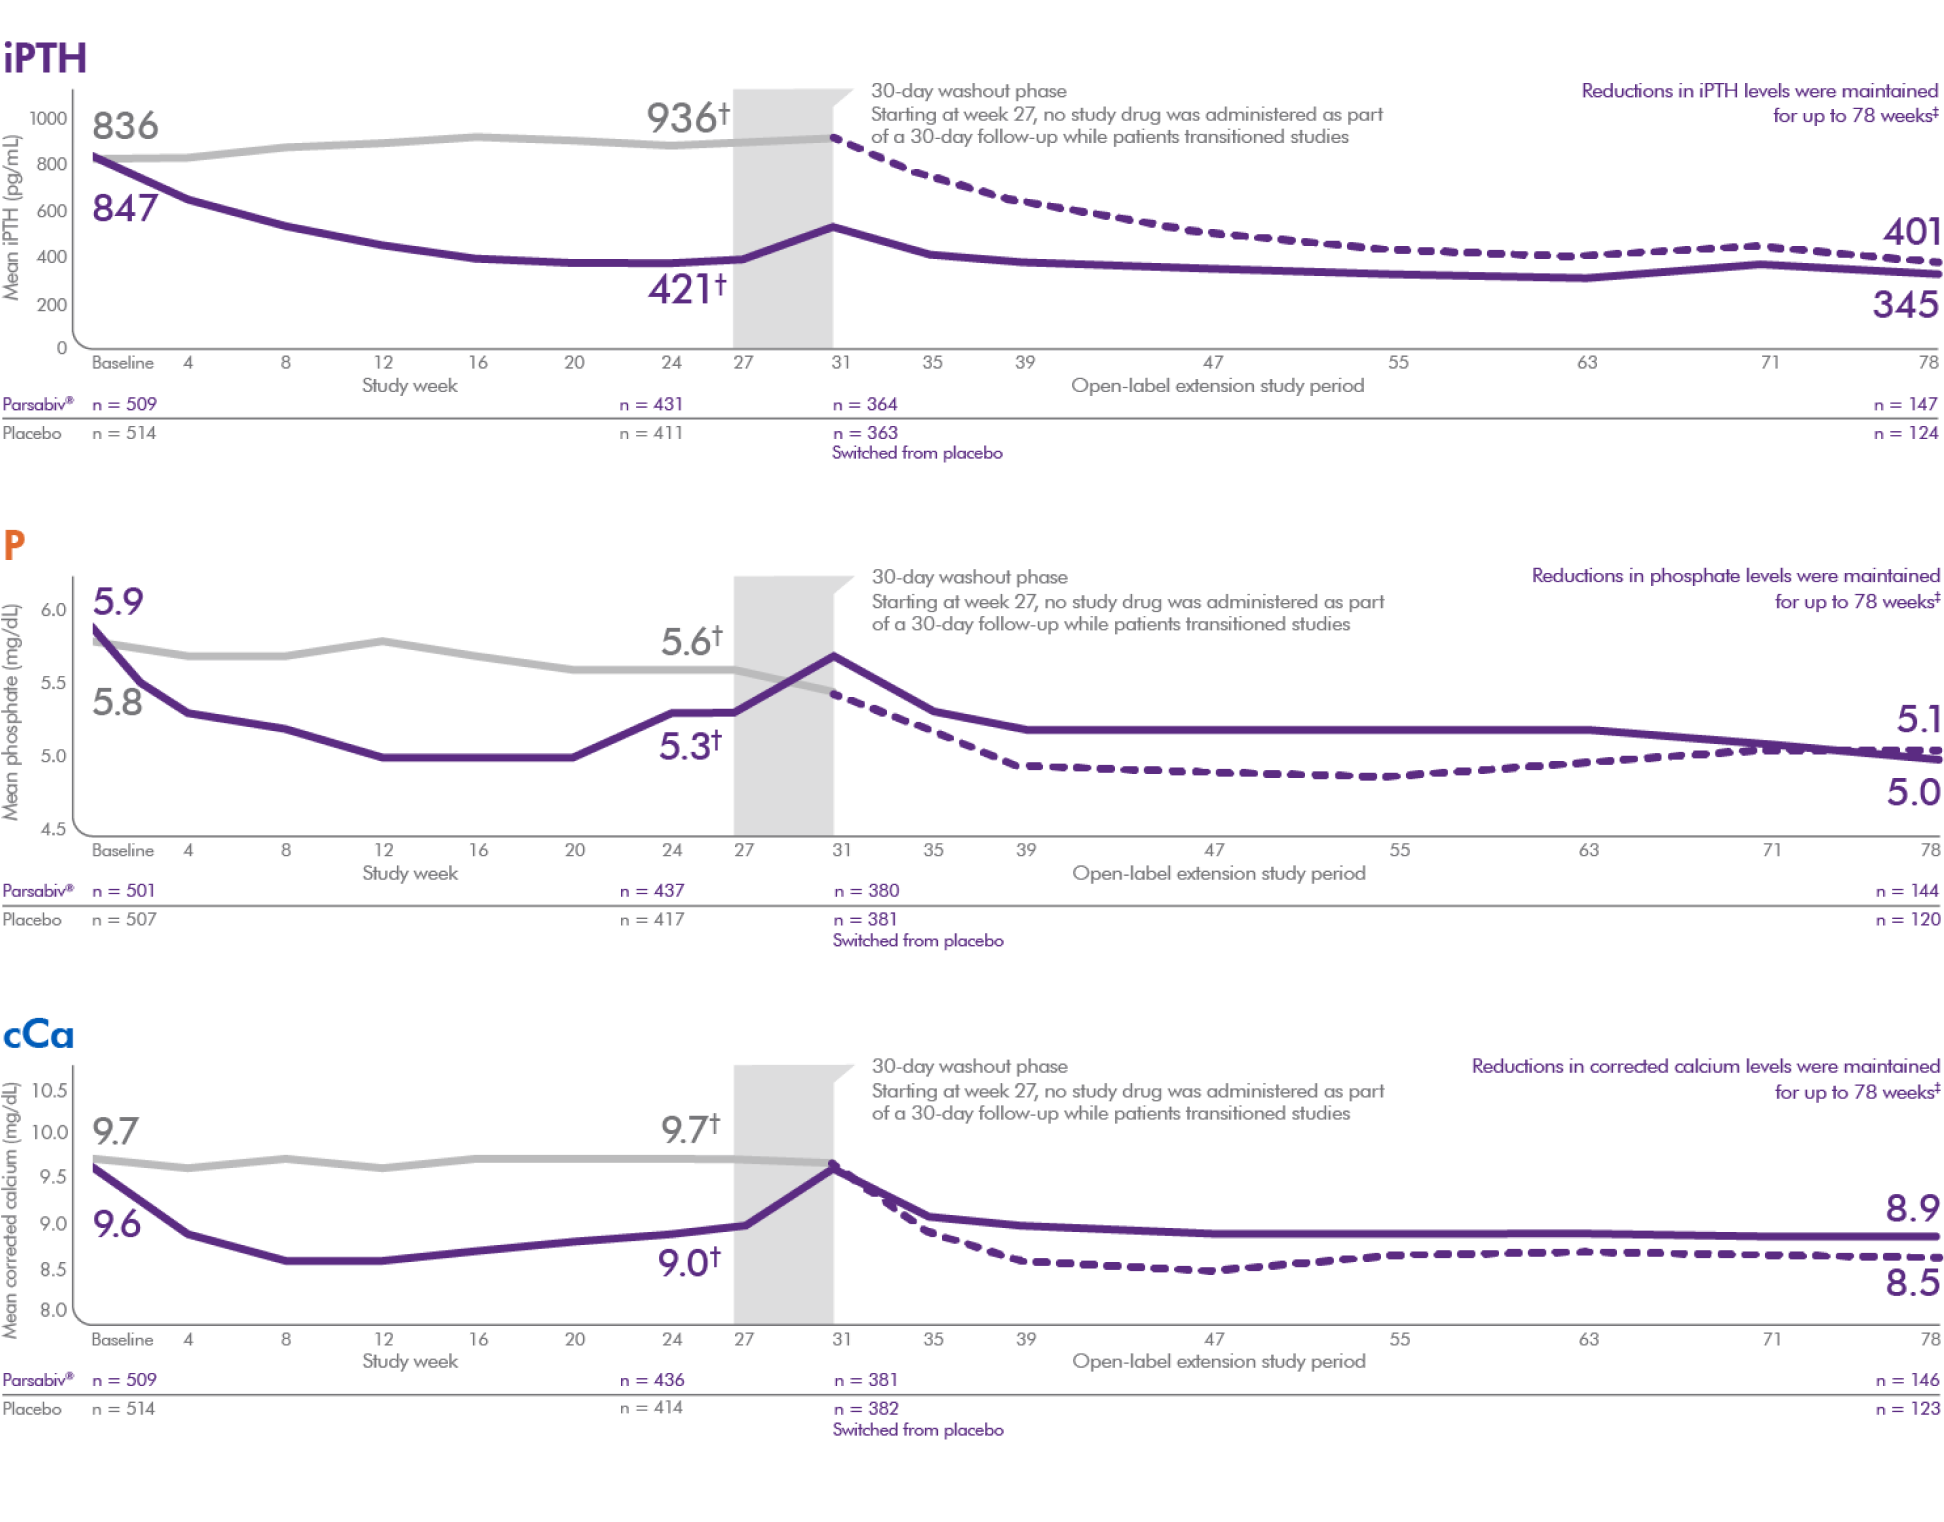
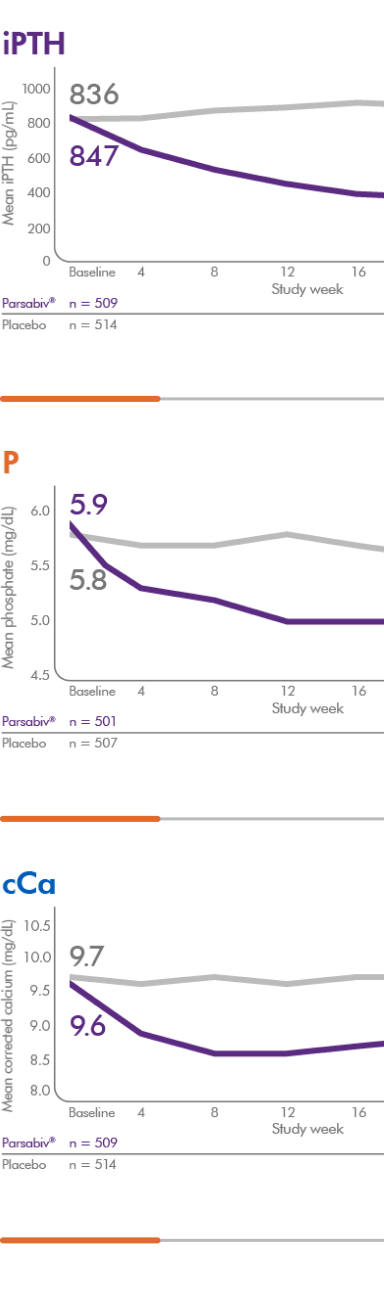
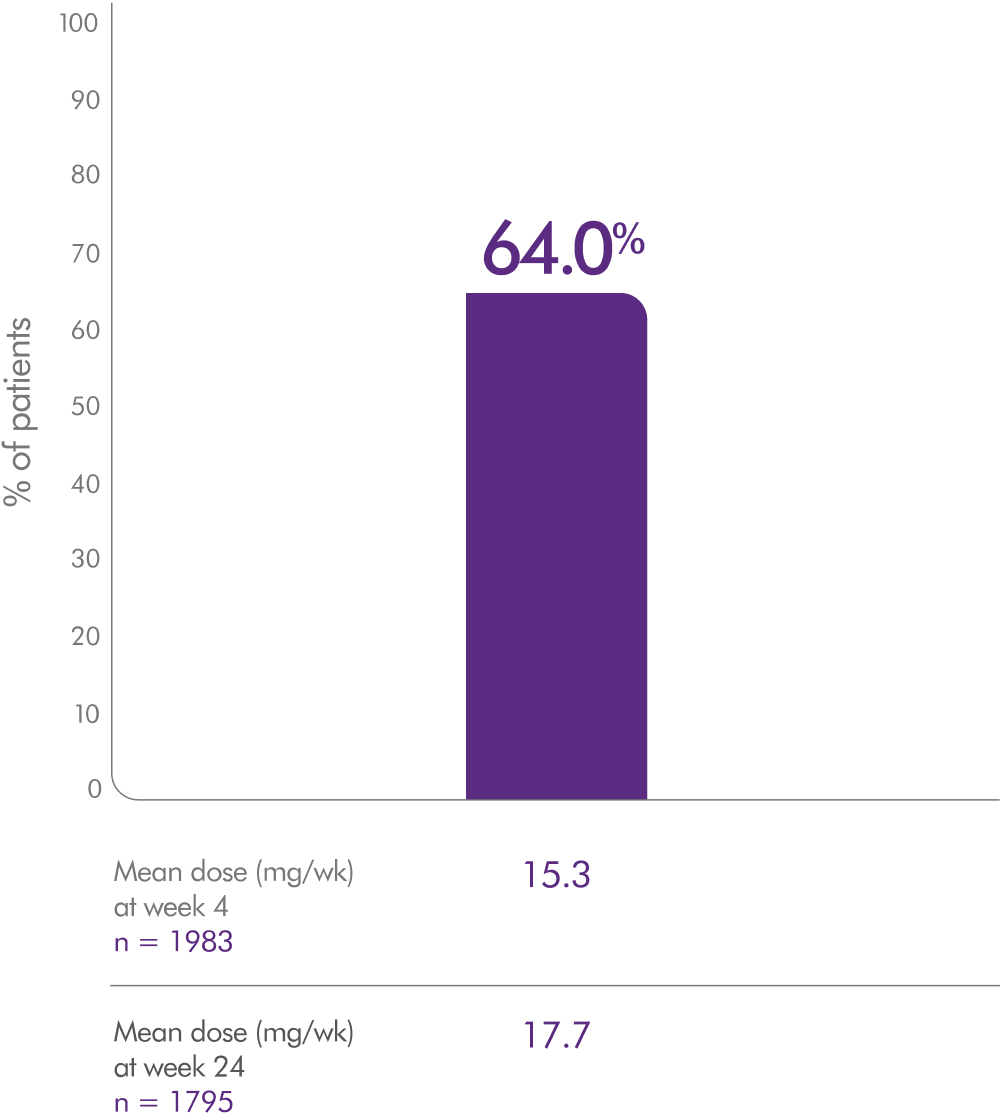
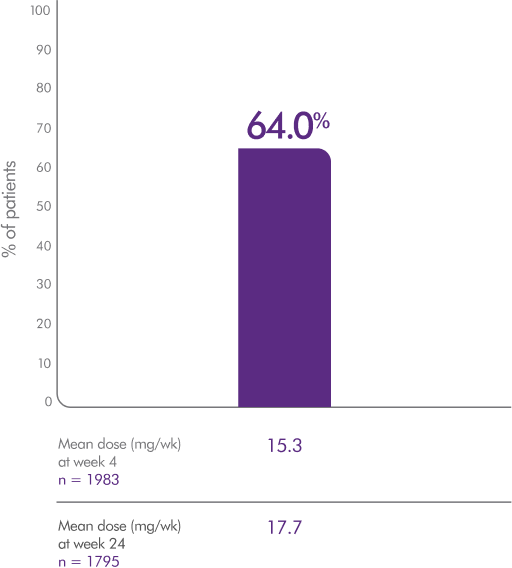
Adverse Reactions: In clinical trials of patients with secondary HPT comparing Parsabiv® to placebo, the most
common adverse reactions were blood calcium decreased (64% vs. 10%), muscle spasms (12% vs. 7%), diarrhea
(11% vs. 9%), nausea (11% vs. 6%), vomiting (9% vs. 5%), headache (8% vs. 6%), hypocalcemia (7% vs. 0.2%), and
paresthesia (6% vs. 1%).
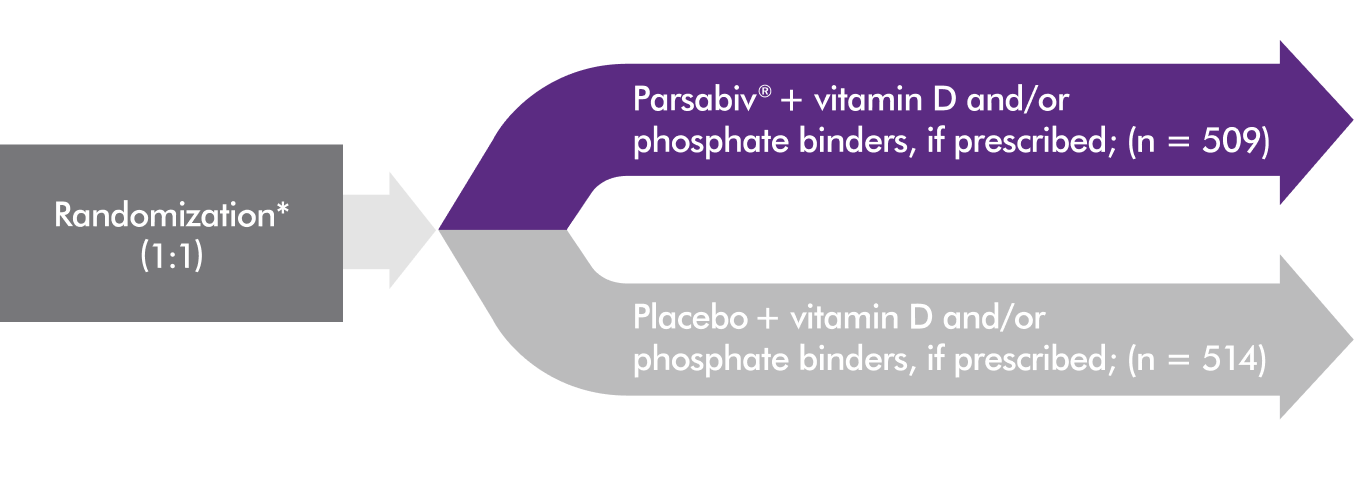
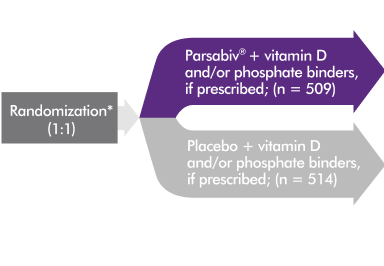
Indication
Parsabiv® (etelcalcetide) is indicated for the treatment of secondary hyperparathyroidism (HPT) in adult patients
with chronic kidney disease (CKD) on hemodialysis.

Limitations of Use: Parsabiv® has not been studied in adult patients with parathyroid carcinoma, primary
hyperparathyroidism, or with CKD who are not on hemodialysis and is not recommended for use in these
populations.

Please see Parsabiv® (etelcalcetide) full Prescribing Information.

Important Safety Information for Parsabiv®

Contraindication: Parsabiv® (etelcalcetide) is contraindicated in patients with known hypersensitivity to
etelcalcetide or any of its excipients. Hypersensitivity reactions, including face edema and anaphylactic reaction,
have occurred.

Hypocalcemia: Parsabiv® lowers serum calcium and can lead to hypocalcemia, sometimes severe. Significant
lowering of serum calcium can cause QT interval prolongation and ventricular arrhythmia. Patients with
conditions that predispose to QT interval prolongation and ventricular arrhythmia may be at increased risk for...

References: 1. Parsabiv® (etelcalcetide) prescribing information, Amgen. 2. Data on file, Amgen; [IQVIA Real-World Evidence; 2020]. 3. Block GA, Bushinsky DA,
Cunningham J, et al. Effect of etelcalcetide vs placebo on serum parathyroid hormone in patients receiving hemodialysis with secondary hyperparathyroidism: two
randomized clinical trials. JAMA. 2017;317:146-155. 4. Data on file, Amgen; [Summary of Clinical Efficacy; 2015]. 5. Data on file, Amgen; [Clinical Study Report
20120229; 2014]. 6. Data on file, Amgen; [Clinical Study Report 20120230; 2014]. 7. Data on file, Amgen; [Average Weekly Dose Vitamin D; 2017]. 8. Data on file,
Amgen; [Combined Phase 3 Lab Values Multiple Imputation Approach; 2017]. 9. Data on file, Amgen; [Time to First Occurrence of iPTH > 30% Reduction from
Baseline-Placebo Studies; 2018]. 10. Data on file, Amgen; [Combined Phase 3 Lab Values Over Time; 2016]. 11. Data on file, Amgen; [Clinical Study Report 20120231;
2015]. 12. Data on file, Amgen; [PTH < 600 by baseline PTH placebo controlled; 2020]. 13. Kidney Disease: Improving Global Outcomes (KDIGO) CKD-MBD Update
Work Group. KDIGO 2017 Clinical Practice Guideline Update for the Diagnosis, Evaluation, Prevention, and Treatment of Chronic Kidney Disease–Mineral and Bone
Disorder (CKD-MBD). Kidney Int Suppl. 2017;7:1-59. 14. Uhlig K, et al. Am J Kidney Dis. 2010;55:773-799.

References: 1. Parsabiv® (etelcalcetide) prescribing information, Amgen. 2. Data on file, Amgen; [IQVIA Real-World Evidence, 2020]. 3.  Block GA, Bushinsky DA, Cunningham J, et al. Effect of etelcalcetide vs placebo on serum parathyroid hormone in patients receiving hemodialysis with secondary hyperparathyroidism: two randomized clinical trials. JAMA. 2017;317:146-155. 4.  Block GA, Bushinsky DA, Cheng S, et al. Effect of etelcalcetide vs cinacalcet on serum parathyroid hormone in patients receiving hemodialysis with secondary hyperparathyroidism: a randomized trial. JAMA. 2017;317:156-164. 5. Data on file, Amgen; [Clinical Study Report 20120360; 2015].

References: 1. Parsabiv®etelcalcetide) prescribing information, Amgen. 2. Data on file, Amgen; [IQVIA Real-World Evidence; 2020]. 3. Block GA, Bushinsky DA,
Cunningham J, et al. Effect of etelcalcetide vs placebo on serum parathyroid hormone in patients receiving hemodialysis with secondary hyperparathyroidism: two
randomized clinical trials. JAMA. 2017;317:146-155. 4. Kidney Disease: Improving Global Outcomes (KDIGO) CKD-MBD Update Work Group. KDIGO 2017 Clinical
Practice Guideline Update for the Diagnosis, Evaluation, Prevention, and Treatment of Chronic Kidney Disease-Mineral and Bone Disorder (CKD-MBD). Kidney Int
Suppl
. 2017;7:1-59. 5. Uhlig K, et al. Am J Kidney Dis. 2010;55:773-799. 6. Data on file, Amgen; [IQVIA PTH < 600 by baseline PTH Real-World Evidence;
2020]. 7. Data on file, Amgen; [Combined Phase 3 Lab Values Multiple Imputation Approach; 2017]. 8. Data on file, Amgen; [Combined Phase 3 Lab Values Over
Time; 2016].